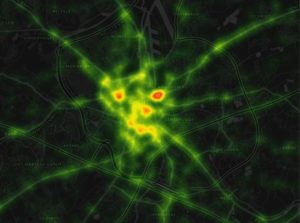
Traffic accidents app for Flanders officially released by the Belgian Federal Police
 The Flanders traffic accidents application developed by InnoConnect(*) as a result of the OpenTransportNet project was officially released June 29 by the Belgian Federal Police.
This interactive map-application received a lot of attention in the Belgian press.
Het Nieuwsblad brought out the news (read here in English using google translator) followed by the 2 national television channels: VRT and VTM.
The popular newspaper Het Laatste Nieuws explained in an excellent way the added value of this interactive tool; they pin-pointed problematic “hot-spots” in 3 Flemish cities and on 2 highways.
As the spokesman of the Belgian Federal police mentioned, the police will use the benefits of this map to define specific traffic accidents prevention actions…
This InnoConnect application, based on WebGLayer, an Open Source Library, visualises more than 52 000 traffic accidents that happened in Flanders between 2014 and 2016. “It’s the first time ever these data are made available in this format. In places where many incidents are close together, the map will turn red,” says Geert Mareels of Informatie Vlaanderen. “The application displays when the accident happened, on what day, at what location, whether it was raining and in what speed zone,” says Wendy De Weser, Federal Police adviser.
The traffic accident statistics are also available via the website of the Belgian Statistical Services but it is the first time these accidents are “geo-located” on a map in such a way. The developers were using OpenStreetMap as map-layer, an “open data initiative” originated in Europe, see more @ Open Street Map Foundation despite the confusing titles in the press articles about “Google a-like traffic accident maps…”
(*InnoConnect is a spin-off of the EU innovation project OTN created by Hugo Kerschot, Jiri Bouchal (IS-practice) and Jan Jezek (University of West Bohemia)

